
News Release
EMBARGOED UNTIL RELEASE AT 8:30 a.m. EDT, Tuesday, July 7, 2026
BEA 26—32
CB 26—111
U.S. International Trade in Goods and Services, May 2026
The U.S. Census Bureau and the U.S. Bureau of Economic Analysis announced today that the goods and services deficit was $77.6 billion in May, up $23.0 billion from $54.6 billion in April, revised.
| Deficit: | $77.6 Billion | +42.2%° |
| Exports: | $317.7 Billion | –3.2%° |
| Imports: | $395.3 Billion | +3.3%° |
| Next release: Tuesday, August 4, 2026<br>(°) Statistical significance is not applicable or not measurable. Data adjusted for seasonality but not price changes<br>Source: U.S. Census Bureau, U.S. Bureau of Economic Analysis; U.S. International Trade in Goods and Services, July 7, 2026 |
U.S. International Trade in Goods and Services Deficit
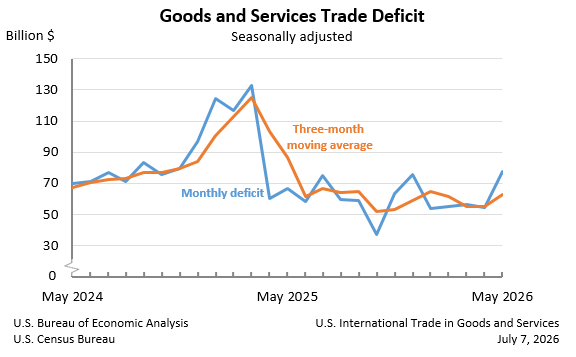
Exports, Imports, and Balance (exhibit 1)
May exports were $317.7 billion, $10.5 billion less than April exports. May imports were $395.3 billion, $12.5 billion more than April imports.
The May increase in the goods and services deficit reflected an increase in the goods deficit of $23.6 billion to $106.5 billion and an increase in the services surplus of $0.6 billion to $28.9 billion.
Year-to-date, the goods and services deficit decreased $203.9 billion, or 40.6 percent, from the same period in 2025. Exports increased $164.7 billion or 11.7 percent. Imports decreased $39.2 billion or 2.1 percent.
Three-Month Moving Averages (exhibit 2)
The average goods and services deficit increased $7.5 billion to $62.9 billion for the three months ending in May.
- Average exports increased $2.0 billion to $321.5 billion in May.
- Average imports increased $9.5 billion to $384.5 billion in May.
Year-over-year, the average goods and services deficit decreased $23.8 billion from the three months ending in May 2025.
- Average exports increased $36.1 billion from May 2025.
- Average imports increased $12.4 billion from May 2025.
Exports (exhibits 3, 6, and 7)
Exports of goods decreased $11.3 billion to $210.6 billion in May.
Exports of goods on a Census basis decreased $11.6 billion.
- Industrial supplies and materials decreased $5.5 billion.
- Nonmonetary gold decreased $6.2 billion.
- Other precious metals decreased $1.3 billion.
- Natural gas decreased $1.1 billion.
- Crude oil increased $2.0 billion.
- Capital goods decreased $3.5 billion.
- Computers decreased $2.1 billion.
- Computer accessories decreased $2.0 billion.
- Consumer goods decreased $2.1 billion.
- Pharmaceutical preparations decreased $0.9 billion.
Net balance of payments adjustments increased $0.3 billion.
Treatment of Gold in BEA’s International and National Economic Accounts
When incorporating the statistics in this release into BEA’s National Economic Accounts, including Gross Domestic Product, or GDP, BEA replaces exports and imports of nonmonetary gold with an adjustment calculated as the difference between domestic production and industrial use of gold. For additional information, see “ How are exports and imports of gold recorded in BEA’s International Economic Accounts?” and “ How are exports and imports of nonmonetary gold treated in BEA’s National Economic Accounts?”.
Exports of services increased $0.8 billion to $107.1 billion in May.
- Travel increased $0.4 billion.
- Other business services increased $0.1 billion.
- Transport increased $0.1 billion.
- Financial services increased $0.1 billion.
Imports (exhibits 4, 6, and 8)
Imports of goods increased $12.3 billion to $317.0 billion in May.
Imports of goods on a Census basis increased $12.1 billion.
- Consumer goods increased $3.5 billion.
- Pharmaceutical preparations increased $1.9 billion.
- Cell phones and other household goods increased $1.0 billion.
- Industrial supplies and materials increased $3.1 billion.
- Crude oil increased $1.5 billion.
- Automotive vehicles, parts, and engines increased $2.2 billion.
- Passenger cars increased $1.0 billion.
- Other goods increased $1.4 billion.
- Capital goods increased $1.1 billion.
- Computer accessories increased $1.2 billion.
- Semiconductors increased $1.0 billion.
- Computers decreased $3.4 billion.
Net balance of payments adjustments increased $0.2 billion.
Imports of services increased $0.2 billion to $78.2 billion in May.
- Insurance services increased $0.2 billion.
Real Goods in 2017 Dollars – Census Basis (exhibit 11)
The real goods deficit increased $15.8 billion, or 18.7 percent, to $100.0 billion in May, compared to a 28.8 percent increase in the nominal deficit.
- Real exports of goods decreased $11.0 billion, or 6.6 percent, to $154.3 billion, compared to a 5.3 percent decrease in nominal exports.
- Real imports of goods increased $4.8 billion, or 1.9 percent, to $254.3 billion, compared to a 4.0 percent increase in nominal imports.
Revisions
Revisions to April exports
- Exports of goods were revised up $0.6 billion.
- Exports of services were revised up $0.5 billion.
Revisions to April imports
- Imports of goods were revised down $0.2 billion.
- Imports of services were revised down less than $0.1 billion.
Goods by Selected Countries and Areas: Monthly – Census Basis (exhibit 19)
The May figures show surpluses, in billions of dollars, with Netherlands ($9.1), Hong Kong ($5.6), South and Central America ($4.8), Australia ($1.9), United Kingdom ($1.4), Brazil ($1.1), Singapore ($0.9), Belgium ($0.7), and Saudi Arabia ($0.3). Deficits were recorded, in billions of dollars, with Vietnam ($20.6), Mexico ($20.1), Taiwan ($19.4), China ($14.5), European Union ($9.3), Canada ($7.0), Germany ($5.7), Malaysia ($4.7), South Korea ($4.4), India ($4.1), Ireland ($4.0), Italy ($2.9), Switzerland ($2.3), Japan ($2.0), France ($1.5), and Israel ($0.4).
- The balance with Switzerland shifted from a surplus of $4.4 billion in April to a deficit of $2.3 billion in May. Exports decreased $6.9 billion to $2.0 billion and imports decreased $0.1 billion to $4.3 billion.
- The deficit with Mexico increased $5.3 billion to $20.1 billion in May. Exports decreased $1.5 billion to $33.4 billion and imports increased $3.9 billion to $53.5 billion.
- The deficit with France decreased $0.9 billion to $1.5 billion in May. Exports decreased less than $0.1 billion to $3.9 billion and imports decreased $0.9 billion to $5.4 billion.
All statistics referenced are seasonally adjusted; statistics are on a balance of payments basis unless otherwise specified. Additional statistics, including not seasonally adjusted statistics and details for goods on a Census basis, are available in exhibits 1-20b of this release. For information on data sources, definitions, and revision procedures, see the explanatory notes in this release. The full release can be found at www.census.gov/foreign-trade/Press-Release/current_press_release/index.html or www.bea.gov/data/intl-trade-investment/international-trade-goods-and-services. The full schedule is available in the Census Bureau’s Economic Briefing Room at www.census.gov/economic-indicators/ or on BEA’s website at www.bea.gov/news/schedule.
Next release: August 4, 2026
U.S. International Trade in Goods and Services, June 2026
Full Release & Tables PDF
Tables Only XLSX
Historical Comparisons PDF
U.S. Trade in Goods and Services, 1960-present XLSX
U.S. Trade in Goods and Services by Selected Countries and Areas, 1999-present XLSX Updated. See the “Readme” tab in this file for more information.
Seasonal Adjustment by Selected Countries and Areas, Frequently Asked Questions
- U.S. Census Bureau, Economic Indicators Division, International Trade
Goods Data Inquiries
eid.international.trade.data@census.gov
- U.S. Census Bureau, Public Information Office
Goods Media Inquiries
- Balance of Payments Division
Services Data Inquiries
- News Media
Services Media Inquiries
Explanatory Notes
Goods (Census basis)
Data for goods on a Census basis are compiled from the documents collected by U.S. Customs and Border Protection (CBP) and reflect the movement of goods between foreign countries and the 50 states, the District of Columbia, Puerto Rico, the U.S. Virgin Islands, and U.S. Foreign Trade Zones. They include government and non-government shipments of goods and exclude shipments between the United States and its territories and possessions; transactions with U.S. military, diplomatic, and consular installations abroad; U.S. goods returned to the United States by its Armed Forces; personal and household effects of travelers; and in-transit shipments. The General Imports value reflects the total arrival of merchandise from foreign countries that immediately enters consumption channels, warehouses, or Foreign Trade Zones.
For imports, the value reported is the CBP-appraised value of merchandise—generally, the price paid for merchandise for export to the United States. Import duties, freight, insurance, and other charges incurred in bringing merchandise to the United States are excluded. The exception is exhibit 17a, which shows CIF import value. The CIF (cost, insurance, and freight) value represents the landed value of the merchandise at the first port of arrival in the United States. It is computed by adding import charges to the customs value and therefore excludes U.S. import duties.
Exports are valued at the f.a.s. (free alongside ship) value of merchandise at the U.S. port of export, based on the transaction price including inland freight, insurance, and other charges incurred in placing the merchandise alongside the carrier at the U.S. port of exportation.
Revision procedure (Census basis)
Monthly revisions: Monthly data include actual month's transactions as well as a small number of transactions for previous months. Each month, the U.S. Census Bureau revises the aggregate seasonally adjusted (nominal and real, or chained-dollar) and unadjusted export, import, and trade balance figures, as well as the end-use totals for the prior month. Country detail data and commodity detail data, based on the Standard International Trade Classification (SITC) Revision 4 and the North American Industry Classification System (NAICS), are not revised monthly. The timing adjustment shown in exhibit 14 is the difference between monthly data as originally reported and as recompiled.
For April 2026, unadjusted exports of goods were revised up $0.6 billion and unadjusted imports of goods were revised down $0.2 billion. Goods carry-over in May 2026 was $0.5 billion (0.3 percent) for exports and $0.1 billion (less than 0.1 percent) for imports. For April 2026, revised export carry-over was less than $0.1 billion (less than 0.1 percent) and revised import carry-over was less than $0.1 billion (less than 0.1 percent).
Quarterly revisions to chain-weighted dollar series: For March, June, September, and December statistical month releases, revisions are made to the real, or chained-dollar, series presented in exhibits 10 and 11: the previous five months are revised to incorporate the U.S. Bureau of Labor Statistics' (BLS) revisions to price indexes, which are used to produce the real series and to align Census data with data published by the U.S. Bureau of Economic Analysis (BEA) in the national income and product accounts (NIPAs).
Annual revisions: Each June, not seasonally adjusted goods data are revised to redistribute monthly data that arrived too late for inclusion in the month of transaction. In addition, revisions are made to reflect corrections received subsequent to the monthly revisions. Seasonally adjusted data are also revised to reflect recalculated seasonal and trading-day adjustments. These revisions are reflected in totals, end-use, commodity, and country summary data.
Other revisions: For December and January statistical month releases, each prior month of the most recent full year is revised so that the totals of the seasonally adjusted months equal the annual totals.
U.S./Canada data exchange and substitution
Data for U.S. exports to Canada are derived from import data compiled by Canada. The use of Canada's import data to produce U.S. export data requires several alignments in order to compare the two series.
- Coverage - Canadian imports are based on country of origin. U.S. goods shipped from a third country are included. U.S. exports exclude these foreign shipments. For May 2026, these shipments totaled $311.0 million. U.S. export coverage also excludes U.S. postal shipments to Canada. For May 2026, these shipments totaled $34.7 million.
U.S. import coverage includes shipments of railcars and locomotives from Canada. Effective with January 2004 statistics, Canada excludes these shipments from its goods exports to the United States, therefore creating coverage differences between the two countries for these goods. 2. Valuation - Canadian imports are valued at the point of origin in the United States. However, U.S. exports are valued at the port of exit in the United States and include inland freight charges, making the U.S. export value slightly larger than the Canadian import value. Canada requires inland freight to be reported separately from the value of the goods. Combining the inland freight and the Canadian reported import value provides a consistent valuation for all U.S. exports. Inland freight charges for May 2026 accounted for 1.6 percent of the value of U.S. exports to Canada. 3. Re-exports - Unlike Canadian imports, which are based on country of origin, U.S. exports include re-exports of foreign goods. Therefore, the aggregate U.S. export figure is slightly larger than the Canadian import figure. For May 2026, re-exports to Canada were $4,639.0 million. 4. Exchange Rate - Average monthly exchange rates are applied to convert the published data to U.S. currency. For May 2026, the average exchange rate was 1.3717 Canadian dollars per U.S. dollar. 5. Other - There are other minor differences, such as rounding error, that are statistically insignificant.
Canadian estimates: Effective with January 2001 statistics, the current month data for exports to Canada contain an estimate for late arrivals and corrections. In the following month, this estimate is replaced, in the news release exhibits only, with the actual value of late receipts and corrections. This estimate improves the current month data for exports to Canada and treats late receipts for exports to Canada in a manner that is more consistent with the treatment of late receipts for exports to other countries.
Nonsampling errors
The goods data are a complete enumeration of documents collected by CBP and are not subject to sampling errors. Quality assurance procedures are performed at every stage of collection, processing, and tabulation. However, the data are still subject to several types of nonsampling errors. The most significant of these include reporting errors, undocumented shipments, timeliness, data capture errors, and errors in the estimation of low-valued transactions.
Reporting errors: Reporting errors are mistakes or omissions made by importers, exporters, or their agents in their import or export declarations. Most errors involve missing or invalid commodity classification codes and missing or incorrect quantities or shipping weights. They have a negligible effect on aggregate import, export, and balance of trade statistics. However, they can affect the detailed commodity statistics.
Undocumented shipments: Federal regulations require importers, exporters, or their agents to report all merchandise shipments above established exemption levels. The Census Bureau has determined that not all required documents are filed, particularly for
Read Original at Bureau of Economic Analysis (BEA) (.gov) →